
The ups and downs of the stock market indexes
This year the FTSE 100 index turns 40. Over the last four decades, it’s become a way to measure the performance of the UK stock market. During that time there have been highs that investors no doubt celebrated, and lows that serve as a reminder that there’s some truth in the saying: it’s time in the market, not timing the market.
The S&P 500, has a longer history, going back to 1957 and similarly captures the highs and lows of the US stock markets, often as a proxy for the health of the US economy.
Before we get into any more detail, a quick break for jargon-busting.
What is an index?
An index is a representation of a stock market that is expressed as a number. There are some hints in their names. The UK’s FTSE 100 captures the largest 100 companies listed on the London Stock Exchange.
The S&P 500, follows the 500 largest companies on US stock markets.
Their purpose is to more easily illustrate how the relevant stock market is performing. It is the change in value over time, that is most relevant, and of most interest to professional investors. This can be misleading though, as we mentioned in our recent article here where we discussed 2023 and our outlook for 2024.
These indexes are dynamic, with the companies that comprise them being added or removed according to their size (market capitalisation). Some companies will drop off as others join. As an illustration, only 20 companies that make up the FSTE 100 were part of the original index when it launched in 1984.
All indexes experience volatility at points in time
On 19 October 1987, the FTSE 100 fell by 10.8% and then a further 12.2% the following day. The S&P 500 fell nearly 28% across the week prior. While it took several years, the indexes recovered and were reaching new highs in the 1990s.
Another example: in October 2008, the S&P 500 fell 20.8% in one week, in a market crash that many will remember.
Whether we are looking at 1987, 2008, 2000, the three weeks in 2020, or 1929, the one point of consistency is that all markets recovered over time.
We can demonstrate this by looking at the FTSE 100. When it launched, its value was 1,000 points. Despite the ups and downs over four decades it hit an all-time high in February 2023 of 8,012.
Similarly, the S&P 500 hit an all-time high this month in February 2024, at 5,029. In 1957 it was worth 40 points.
That growth in value of the S&P 500 is approximately 9% per annum compounded, even taking into account the times it fell.
Savvy investors stick to their financial plans and continue to add to their investments when markets fall.
The key message of this article is this: If investors panic when markets experience volatility and take their money out when markets fall, they will likely miss on the recovery and associated future gains.
Short-term volatility is part of investing and is impossible to consistently predict. So, rather than trying to time the market jumping out and back in again, holding assets over a long time frame makes sense for many investors.
To paraphrase our managing director, Edward Mainwaring-Burton, there two certainties when it comes to investing: when markets are going up, they will eventually fall for a period; and when markets are falling, they will eventually, and inevitably rise again. Markets rise, and fall, but over time they grow more than they shrink.
You can see that in this graph of the S&P 500 across the last 50 years here below. What feels like market falls that may never end in the moment of their occurrence, when looking back can be seen as small blips on the trajectory of growth.

Timing the market?
For completeness, let’s address the timing of the market approach. To be clear, we believe it is very difficult and almost impossible to time the market with any great accuracy and consistency. The impact of getting it wrong is notable. Our advice here is don’t do it!
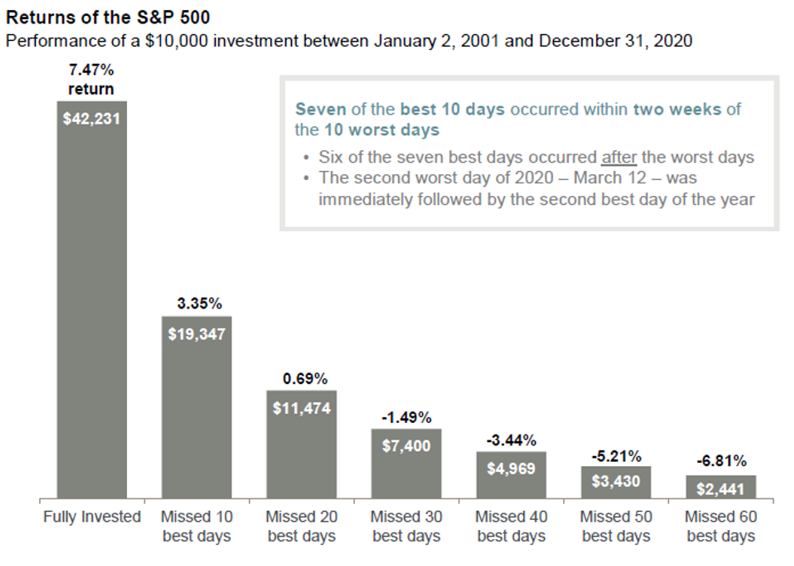
Here is an example from JP Morgan as presented in Forbes magazine, showing the performance of the S&P 500 for the first 20 years of this millennium. The graph is very clear, if you are uncertain, and choose to sit out of the market waiting for the ‘right time’ to re-enter, you are likely to miss the best days, and in doing so, you reduce your potential returns, compared to the person that remained invested. And why is it likely an investor following this approach will miss the best days? Because they wait for evidence of momentum, to see the market recovering before the re-enter the market, thereby missing those days.
In summary, time in the market, being objective, consistent, and remaining aligned to your objectives and your financial plan, is a more likely path to financial success. It’s not always easy, and that is where having a good adviser like Black Swan Capital can help.
Get in touch to talk about your investments
There are many other factors that can impact your decision making when it comes to managing your money. If you would like to discuss your existing investments, or if you need help getting started, you can contact us at info@blackswancapital.eu or book an appointment on our website here, and we will be happy to speak with you.
We could help you build an investment portfolio that suits you and aligns with your risk profile. Please get in touch to arrange a meeting.
Please note:
This blog is for general information only and does not constitute advice. The information is aimed at retail clients only.
The value of your investments (and any income from them) can go down as well as up and you may not get back the full amount you invested. Past performance is not a reliable indicator of future performance.